
A 2017 market retrospective
A 2017 market retrospective
Welcome to this week’s edition of the Rhizome WIRE!
Just how did 2017/18 play out?
This week, as Bitcoin continued it’s rapid climb and eclipsed $18,000 — thus flirting with hitting its previous all-time high—there was great excitement throughout the crypto world, especially on social media.
However, after this initial enthusiasm, a new emotion began to take shape. As holders of various alt-coins looked at their portfolios all they saw was…red. And while Bitcoin holders continued in their elation, alt-coin holders became despondent, as the morale on crypto social media began to darken (despite the fact that alts remained in basically the price range they’ve been for the past few weeks).
Of course, it’s understandable as to why this reaction occurred. Bitcoiners were getting rich, and alt-coiners were not.
“Will we be left behind in this bull market?” many wondered.
“Bitcoin is rising because it’s the only coin institutional investors care about?” others lamented.
Ultimately, I believe the biggest culprit for this feeling — aside from seeing one token go up while others don’t — is the clouded memory of 2017/2018’s bull market. The memory that most people seem to have was the full-on market going nuts, with every token, Bitcoin or otherwise, rapidly climbing in value at the same time. In the context of a multi-year time span — as one is doing when thinking back from today to four years ago — this is a fairly true representation. The market as a whole did rise in that general time period.
Unfortunately, what many are doing today, is applying a multi-month memory upon Bitcoin’s three-day price movement. See the problem?
In order to calm some emotions, let’s actually take a look at how the 2017 market began and evolved.
Bitcoin
First, let’s go back in time to December of 2013. This was the highest parabolic run that Bitcoin had seen, rising to a new all-time high of around $1,127 (according to CoinGecko’s chart, which all prices in this article will be based around).
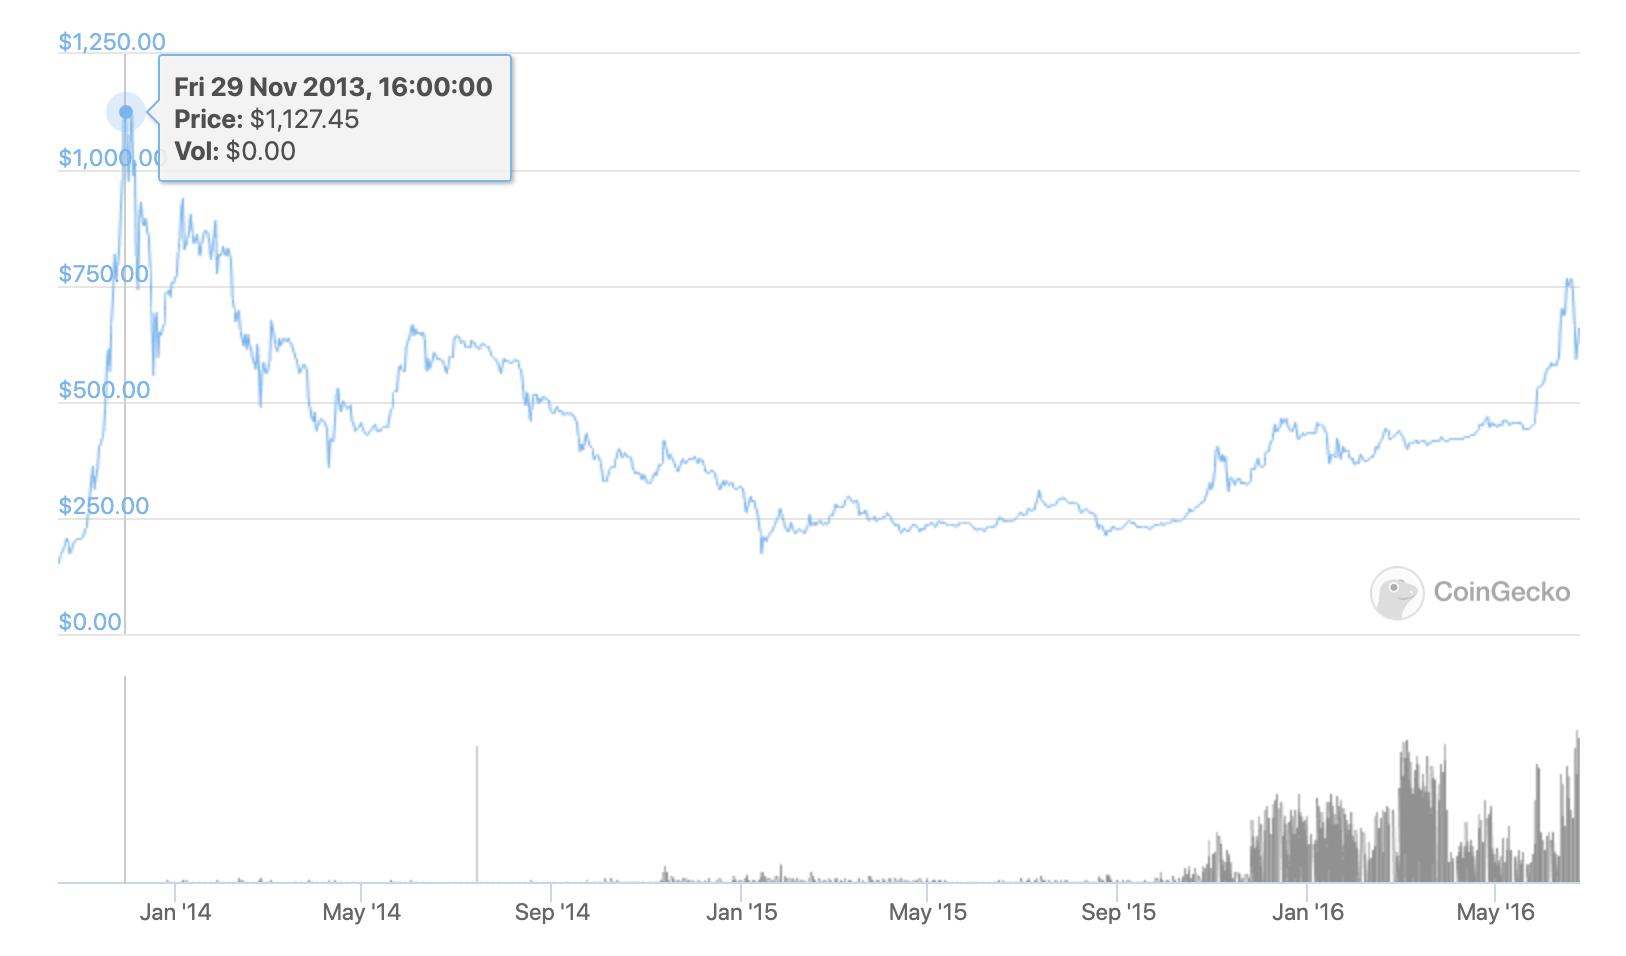
As you can see, it “crashed” afterward, falling all the way down to around $200 in early 2015. This was nearly 1/6th of it’s price at all-time high (sound familiar?).
It wouldn’t again see it’s all-time high again until January 2017 (about four years later…sound familiar?), when it briefly touched the prior high, and fell back again. Take note of the fact that Bitcoin started November in the $700s, making a fairly rapid ascent to it’s new all-time high by January.

After falling back from all-time high briefly, Bitcoin ramped back up, eventually beginning the climb that would bring it to it’s current (as of today) all-time high of the mid $19,000s in mid-December of 2017.
Ethereum
Prior to the 2017 bull-run, Ethereum’s previous all-time high was $20.51, set in June of 2016 (less than a year after Ethereum’s price showed up on the chart).

Ethereum wouldn’t see that price again until March of 2017 — about two months AFTER Bitcoin saw its prior all-time high. In other words, Ethereum’s momentum ran about two months behind Bitcoin’s. Meanwhile, it reached it’s current all-time high of $1,448 in mid-January of 2018 — about a month after Bitcoin reached its top.
XRP
Let’s take a look at XRP (Ripple). Although this is seemingly everyone’s favorite coin to hate on, it does help with our analysis in the sense it’s a tier below Ethereum and Bitcoin in terms of market cap (especially at the time period under examination).
XRP’s prior all-time high was around $.05, which it hit in late November of 2013 — basically the same day Bitcoin hit its local all-time high, indicating overall momentum for the market as a whole.
With brief exceptions, XRP fell hard after that, and was less than a penny for the next several years. It would once again make a run toward it’s all-time high in late April of 2017 — about a month after Ethereum hit its all-time high.
XRP would go on to hit $3.40 in early January of 2018 before tumbling downward again.
Dogecoin
Again — not everyone’s favorite coin — but it serves a purpose here in the sense it’s a tier below XRP, and also has enough price history for the purpose of this analysis.
Dogecoin hit an initial all-time high of $0.0018 in early 2014. It wouldn’t hit that price again until…May 2017. A month after XRP hit it’s all-time high, two months after ETH, and about four months after Bitcoin.

Big Picture
So, to summarize, here is about when each token hit it’s prior all-time high.
Bitcoin - January 2017
Ethereum - March 2017
XRP - April 2017
Dogecoin - May 2017
Of course, each would go on to much greater heights after hitting their prior all-time high (although it would take between six months to a year in each case for that to happen — but with each token, it was basically an ongoing succession of green candles).
There’s an image that was sent in ICON’s Telegram price discussion channel that summarized this pattern quite nicely:

This basically describes, in a macro sense, what I described above. Historically speaking, it plays out over a series of months — not weeks or days.
How does this happen?
Well, Bitcoin is clearly the driver of the market, the most popular token, and the coin that brings the most attention to the market. So it goes up first. As it starts to climb, traders typically hop out of alt coins, as they don’t want to see their alt-coin value (denominated in BTC) erode in value as Bitcoin makes a run. So they flee to Bitcoin. This is partly FOMO, but partly utilizing BTC as a store-of-value. That’s why alt coins typically fall in BTC value as BTC rises — but also often fall in USD value as well.
After a while, as Bitcoin’s price stabilizes a bit (consolidates), money starts to flow down a bit, hitting mid-caps such as Ethereum, Litecoin or other tokens in the Top 10. Then, the money flows to small caps — such as ICON.
This process nothing to do with news. This process nothing to do with marketing. This process nothing to do with fundamentals. It’s just how a young market like crypto works.
Now, I’m not saying what happened in 2017 is going to play out exactly the same way (although crypto does tend to repeat itself). However, if you’re a believer that 2021 will be “the year” for crypto, then the train is currently right on schedule — especially if Bitcoin manages to breach it’s all-time high in the next couple of months.
So, there’s a chance Bitcoin hits it’s all-time high soon. And it’s likely your alt-coins will be sitting there, possibly still in the red. When this happens, don’t panic. Instead…

News from ICON World
DAOLevels has surpassed 1M transactions for the ICON network


RHIZOME team member, Andrew Burns as well as several others helped develop DAOLevels and bring it to the ICONbet platform - which is currently the largest source of transactions within the network.
Naver Cloud and OpenBase join ICONLOOP’s MyID Alliance


In case you’d like to learn more about the various partners and entities associated with the alliance, we post infographics detailing each partner weekly and what they’re bringing to the alliance. Feel free to follow the ongoing twitter thread.
ICON Foundation signs an MOU with Band Protocol

Of equal importance, ICON Foundation is now a validator on the Band Protocol network. Band Protocol has also spun up a P-Rep node on the ICON network as well. You can read more about this announcement here.
More ICONLOOP adoption!


ICX is now available on Simple Swap


Blockchain Industry News
Binance says it sued Forbes and two writers for defamation 'to seek justice' - The Block
The lawsuit is in response to a recent Forbes story, penned by the writers Michael del Castillo and Jason Brett, which claimed that Binance "conceived of an elaborate corporate structure designed to intentionally deceive regulators," among other allegations.
Ether Trades Above $500 for the First Time Since July 2018 - CoinDesk
Apart from the broader market uptrend, Ethereum's impending transition to proof-of-stake looks to be powering gains in ether, according to Nischal Shetty, CEO of Mumbai-based cryptocurrency exchange WazirX. "The belief is that it'll lead to a supply shortage of ether," Shetty said.
Bitcoin Now Has a Greater Market Cap Than Mastercard - Decrypt
Bitcoin’s market cap amounts to nearly $338 billion while the coin’s price hovers around $18,270. According to AssetDash’s data, Bitcoin’s capitalization increased by 3%—enough to push payment giant Mastercard back to 17th place as its market cap lost 0.6%.